Pre-Seed · 2026

The consumption layer for
agentic shopping.

Trepo helps households know what food they have, what to cook, and what to buy next, creating consumption data that shopping agents need.

Trepo · Confidential
Team

Founders.

Matt Taylor

Matt Taylor

Product & Engineering

Former Tesla and Nuro engineer with experience in complex hardware and manufacturing, including Tesla’s Cybercab. Leads product and engineering for Trepo.

Zach Slaughter

Zach Slaughter

Revenue & Marketing

Experience in consumer data and advertising campaigns at Viant, and consumer sales and marketing at USCAPE. Leads revenue and marketing for Trepo.

USCAPE
2 · Team
Problem & Opportunity

Procurement is measured to the cent. Consumption is not measured at all.

The household
  • 1“What do I have?” The fridge is a black box the second it closes.
  • 2“What’s for dinner?” Asked every night. Answered by nothing they own.

Consumers shop from memory, buy it twice, and still stand there asking, “what’s for dinner?”

The brand
  • 1Retail media is the fastest-growing ad channel in the world, and it runs on purchase history.
  • 2Every retailer sells its own slice, cut its own way. Kroger’s data doesn’t line up with Trader Joe’s.

Nobody sees the whole household, or whether the product got used.

The agent
  • 1Agentic shopping is where all of this is going, and it is being built on purchase data alone.
  • 2That data is stitched together across stores, missing pieces, and always late.

An agent that cannot see the kitchen is guessing.

3 · Problem
Value Proposition

Households use Trepo. Brands buy the data. Agents cannot work without it.

What the household gets
  • •Know what you have. Every item, live.
  • •Know what to cook. Dinner from what is already in there.
  • •Never run out. Running low moves straight to the list.
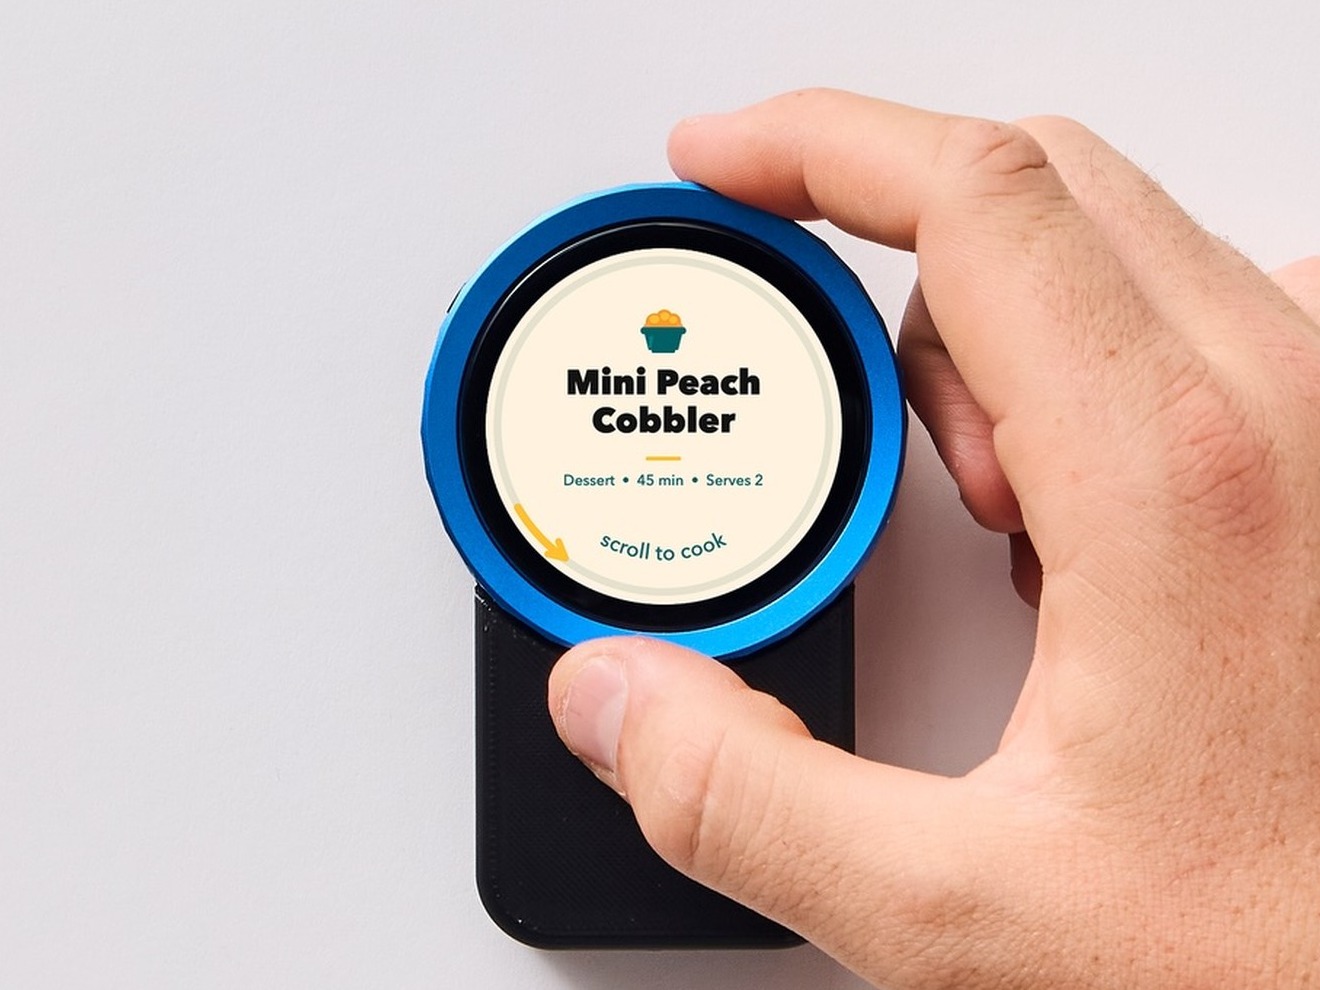
Scrolling a recipe on the Trepo Kitchen Assistant
What the brand gets
  • •Household consumption, across every store their buyer shops.
  • •Repeat vs. trial, the replenishment window, the whole basket.
  • •Sampling, coupons and audiences built on everything in the kitchen and how fast it goes.
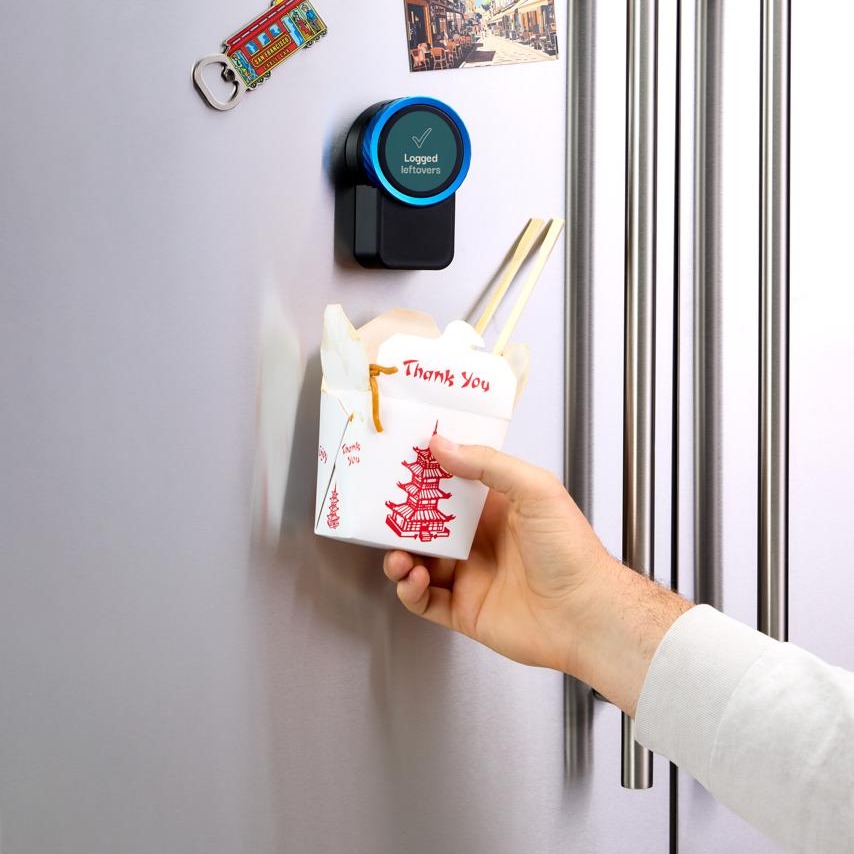
Leftovers logged on the Trepo Kitchen Assistant
What it unlocks · agentic
  • •The input layer no agent has: what a home eats and when it runs out.
  • •The list stops being a list and becomes the order.
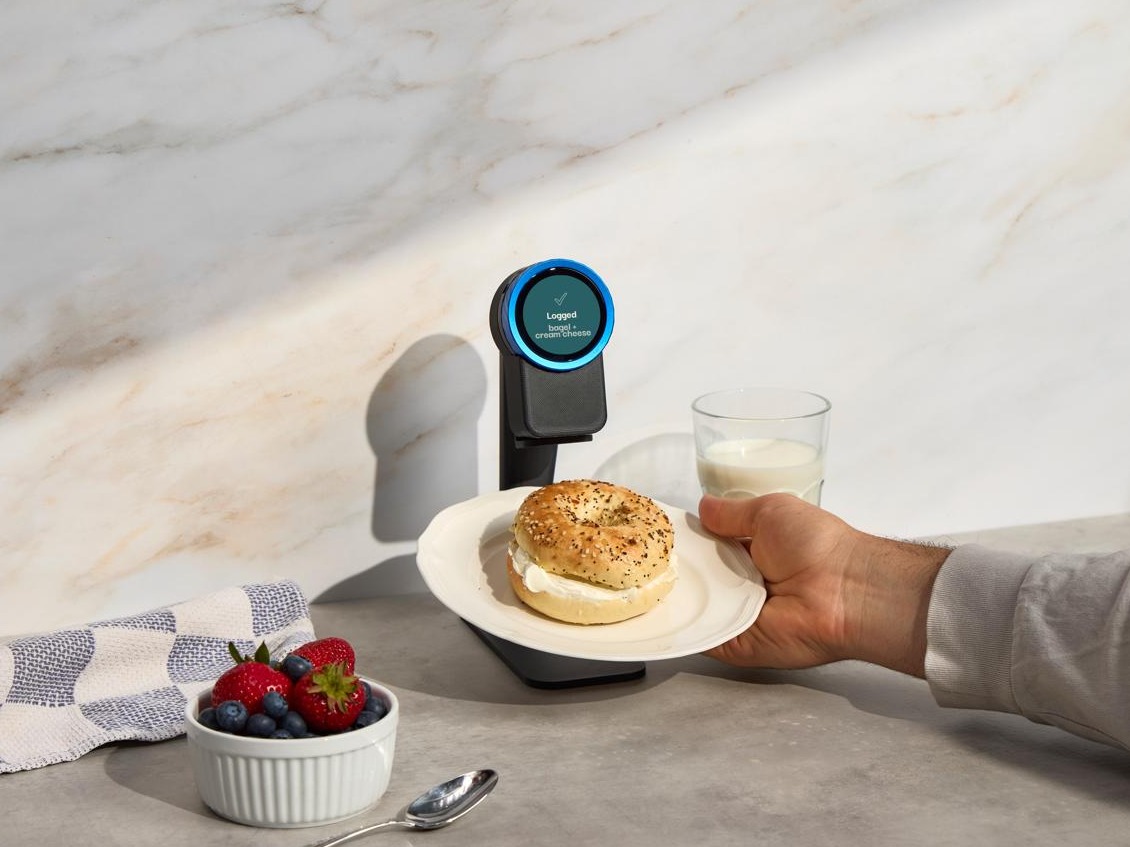
A bagel logged on the Trepo Kitchen Assistant
4 · Value Proposition
Underlying Magic

Consumption is the only real demand signal.

A purchase tells you a unit left a shelf. Consumption tells you it was used, when it will be needed again, and what happened around it: what got cooked with it, what was scanned in the same minute, what the household reached for instead.
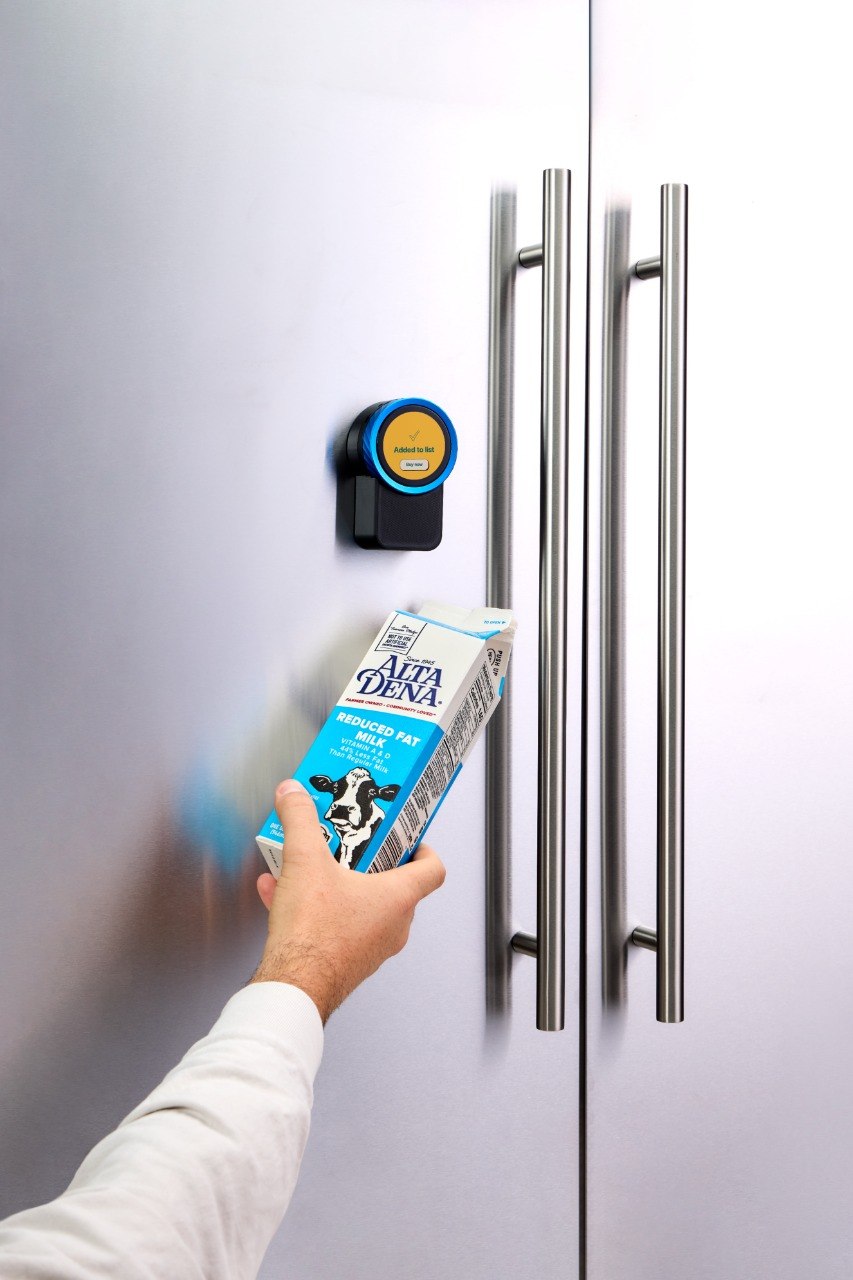
Scanning milk on the Trepo Kitchen Assistant with the device screen visible

Twelve-pack in Saturday, gone by Wednesday

Three a day, every week, for months. We know the Thursday before they run out.

Yogurt every nine days, then nothing

They did not run out and they did not stop eating yogurt. They switched brands, and we can see to what.

Three stores in one week

Costco on Sunday, Trader Joe’s on Wednesday, Albertsons on Friday. One basket no single retailer can assemble.

Chicken out, rice and peppers out, twenty minutes later

Not three purchases. One meal. That is the pattern a receipt can never show.

5 · Underlying Magic
Business Model

One dataset. Two revenue lines. One flywheel.

THE KITCHEN GRAPH Households log what they eat The graph learns what runs out when Brands pay for it, agents act on it Revenue funds more households
Ad products on the consumption graph
  • •Sampling, couponing, basket tracking, audience profiles.
  • •The products CPG already buys from Kroger, Instacart and NIQ, sold against a dataset and a signal none of them have.
Agentic replenishment
  • •Once the graph knows the cadence, the list becomes the order.
  • •We earn a share of a basket the household was always going to buy. Because we can see the kitchen, we know it is needed before anyone else does.

Who buys this over time: consumers, through the app and the Kitchen Assistant · CPG brands and their retail media budgets · retailers and delivery platforms · and the food-automation and home-robotics companies that will need in-home consumption to train on and cannot collect it themselves.

6 · Business Model
Go-to-Market

No paid ad acquisition. 13,000+ users.

13,371
Users signed up
281,726
Items logged into kitchens
112,207
Recipes generated
32,042
Recipes saved straight off social
5K10K15K Organic Step change 13,371 users LAUNCH · 25 JUN 11 JULY TODAY
7 · Go-to-Market
Competition

Everyone is building the agent. Nobody is building its input.

Purchase history · laggingConsumption · live, in-home
Retailer
loyalty
Instacart,
DoorDash
Panel & scan
(NIQ, Circana)
Samsung Food,
Whisk
Smart fridges,
notes apps
Trepo

Agentic shopping

  • •Instacart, DoorDash, Amazon and the assistants can place the order.
  • •None of them can see the kitchen.
  • •They know the items you bought from a specific retailer, not what you have consumed or need.

The data incumbents

  • •NIQ, Circana and retailer clean rooms sample purchases.
  • •Weeks late, one banner at a time.
  • •Their data is a by-product of a transaction they own, and nobody logs a pantry into a checkout.

The consumer product

  • •Samsung Food and Whisk are recipe apps with no inventory.
  • •Notes apps do not deplete.
  • •Smart fridges put a camera behind a $3,000 door.
8 · Competition
Financials

What one household is worth, and the pool it sells into.

1 household · per year
 Retail mediaInstacart's advertising and other revenue is 2.8% of GTV (Q1 2026), applied to the whole household basket$211
+Replenishment transactions$7,532 US grocery spend per household × 7.1% take from consumers and retailers — Instacart's transaction rate (Q1 2026), applied to the whole basket$535
=Revenue per household,
per year
$746
The comp · Instacart Q1 2026
7.1%transaction + 2.8%advertising & other = 9.9%of GTV

A $100 cart returns about $9.90 to Instacart before expenses. We model the same two slices — 7.1% transaction, 2.8% retail media — but against the whole household basket rather than the orders one platform delivers.

TOTAL POOL · ANNUAL, US $198B $127B US online grocery 19% of all US grocery spend $71B US retail media ad spend 2026 forecast, eMarketer
Bottom-up: 5M households at $746 is $3.7B a year, just under 2% of the pool above. The transaction take is the assumption to press on — it is Instacart's rate on the orders it fulfils, applied here to the whole basket. 5M households is vision scale, not what this round buys.
What the pre-seed buyswhere the twelve-month plan ends
50,000
Users, from 13,000
5,000+
Kitchen Assistants deployed
$2M
Projected revenue
9 · Financials

Let’s build the consumption layer.

Matt Taylor
matt@trepo.ai
10 · Contact